[Estimated time: 5 mins]
Some people have pointed out that it’s hard to test the theory of development put forward by Joe Studwell in How Asia Works because it’s a complex theory with many different pieces. This is entirely fair. But unfortunately I think development simply is very complex and involves many different factors.
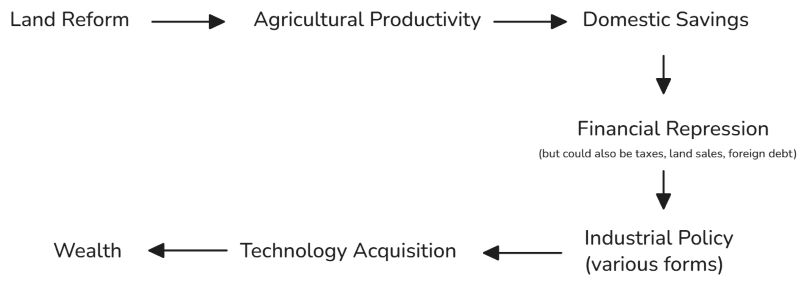
So I had a go at distilling Studwell’s argument into causal diagrams because I think they can help understand us his arguments. Studwell sets out a 3-step formula, and I convert each of those steps into different diagrams before combining them all.
Here’s the first piece:

This causal diagram shows how land reform can fund industrial policy. Of course, there may exist other ways to fund industrial policy, but the existence of other causal paths doesn’t preclude this one. Korea, for example, relied more on external borrowing and less on domestic savings than the other East Asian economies.
Studwell also points out that lifting agricultural productivity in Korea was still important because it kept large numbers of people employed until manufacturing jobs were available, provided a rural domestic market for early manufacturers, and reduced Korea’s dependency on food imports. So while there are other benefits that come with agricultural productivity, my diagram just focuses on how it contributes to Industrial Policy as that’s the main argument in the book.
Second piece:

This I think is the most contentious piece of Studwell’s theory, because there are so many different forms of industrial policy and many of them do not result in successful technology acquisition. According to Studwell, export discipline is key, but I’m not sure how to show that on a diagram. Suffice to say that there are many ways in which the causal link between Industrial policy -> Technology acquisition can get disrupted.
Third piece just adds an extra node in the first piece:

In other words, financial repression is the mechanism by which Domestic Savings get converted to funding for Industrial Policy. But, of course, there are other ways to fund industrial policy, such as land sales, income taxes, or foreign debt.
(Technically the middle node should perhaps be called “State’s Financial Resources from Financial Repression”, rather than “Financial Repression” itself, as the current diagram seems to suggest that Domestic Savings cause Financial Repression. But in interests of brevity I’ve left it as is.)
Finally, we can combine all three pieces into one giant chain:

This causal chain seems pretty plausible to me, though the link between Industrial policy (various forms) -> Technology acquisition is a crucial one that is by no means ironclad. There are also probably other things, such as relatively high state capacity or low corruption, that determine how strong that relationship is.
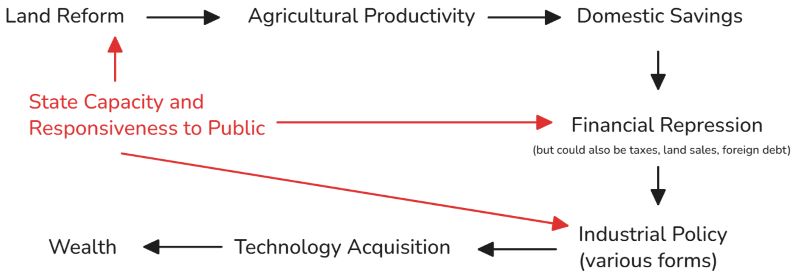
In fact, I suspect State Capacity and Responsiveness to Public is a big invisible confounder that affects multiple points in this chain:
- whether Land Reform successfully lifts Agricultural Productivity;
- whether Financial Repression funds Industrial Policy (or just elite consumption); and
- whether Industrial Policy leads to successful Technology Acquisition.
So perhaps the diagram looks more like this:

So yes, this does seem very hard to test, especially as most of these nodes are not directly measurable and the causal relationships are not deterministic. But Studwell’s theory nonetheless seems plausible.
It’s kind of like baking a cake. You might be able to sub in an ingredient that proved crucial in one case with something entirely different in another, just as a baker might sub in applesauce and baking soda for eggs. In another case, you might have all the necessary ingredients in place, but still screw up in combining them. But development is far harder than that, because there are not that many examples to go off and circumstances are always changing. So it’s more like trying to bake a cake for the first time based off a handful of dubious secondhand accounts as the temperature, atmospheric pressure, and humidity all fluctuate, with a bunch of people telling you you’re doing it wrong, and some of them might even succeed in turning off your oven and shoving you out of the kitchen.
And I’m still probably underselling how difficult development is.
Let me know what you think of my diagrams in the comments below! Am I missing any important nodes?
You may also like:
2 thoughts on “How Asia Works with causal diagrams”
Nice, you definitely got across the complexity, but managed to make it feel like there’s some sort of causal chain, the diagrams are very helpful—I know how difficult distilling this stuff is so, well done.
Thanks James, appreciate it 🙂