[Estimated time: 6 mins]
On 26 January 2026, The Economist published an optimistic article arguing that AI won’t displace white collar jobs. Specifically, the article claimed:
Rather than wipe out office jobs, artificial intelligence will expand their scope and raise their value.
They followed that up with a podcast on 19 February making the same points. Some of the numbers in that article (and repeated in the podcast), pinged my BS detector. I was particularly sceptical of their claim that “America has … 21% more paralegals than three years ago”, as well as the figures in the below infographic:
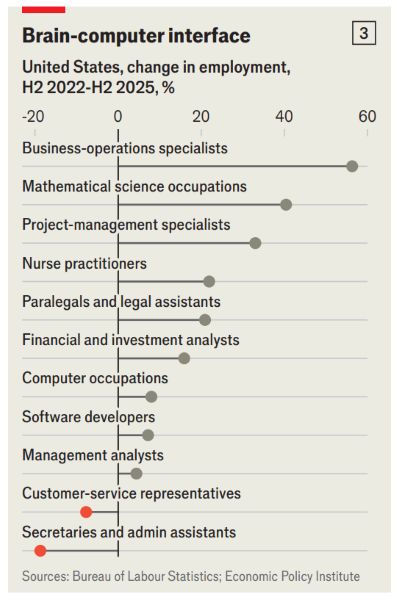
So, I decided to look up the data on FRED, which also shows data from the Bureau of Labour Statistics, at an annual frequency. I found three significant problems:
- There was no baseline given for comparison
- The roles appear to be cherry-picked
- Some of the data does not seem reliable
1. No baseline
The first issue is that The Economist had shown job growth rates for certain occupations between 2022-2025, without providing a baseline for comparison. How do we know the growth in these white-collar occupations didn’t just reflect growth in the US economy more generally? How did job growth compare to previous 3-year periods?
So I compared the 2022-2025 job growth figures with the 2016-2019 figures for the same roles. (I skipped over 2019-2022 because of Covid.) Here’s what I found (units are in thousands of persons):
| Occupation | 2016 | 2019 | Change (%) | 2022 | 2025 | Change (%) | Difference |
|---|---|---|---|---|---|---|---|
| Business and Financial operations | 6195 | 6748 | 8.93% | 7799 | 8463 | 8.51% | -0.41% |
| Computer and mathematical occupations | 4104 | 4947 | 20.54% | 5733 | 6297 | 9.84% | -10.70% |
| Nurse practitioners | 2498 | 2640 | 5.68% | 2753 | 2896 | 5.19% | -0.49% |
| Paralegals and legal assistants | 351 | 364 | 3.70% | 388 | 378 | -2.58% | -6.28% |
| Computer programmers | 403 | 425 | 5.46% | 422 | 352 | -16.59% | -22.05% |
| Software developers | 1351 | 1714 | 26.87% | N/A | N/A | ||
| Customer service representatives | 1850 | 1977 | 6.86% | 2097 | 1928 | -8.06% | -14.92% |
| Office and administrative support | 13866 | 13954 | 0.63% | 12808 | 12812 | 0.03% | -0.60% |
The picture is considerably bleaker when you compare job growth over the last 3 years with that in 2016-2019. In every chosen category, job growth was weaker between 2022-2025 compared to 2016-2019. For example, while “Computer and mathematical occupations” showed 9.8% job growth between 2022-2025, this was actually a steep drop from 20.54% job growth between 2016-2019.
To be fair, there are other differences between the 2016-2019 period and the 2022-2025 period. Perhaps the 2022-2025 saw slower job growth in tech because firms had overhired during the pandemic, rather than because of AI. But the weaker job growth was not confined to tech roles. This is by no means definitive proof that AI is displacing white-collar jobs — but it is hardly reassurance that these jobs are safe.
2. Cherry-picked data
You may notice that the roles in my above table do not exactly match the roles in The Economist’s infographic. This is because the FRED website only provides data for certain broad categories, and The Economist seems to have cherry-picked a couple of small subcategories that showed particularly strong job growth.
According to their infographic, the top 3 roles that showed the biggest job growth were:
- Business-operations specialists;
- Mathematical science operations; and
- Project-management specialists.
However, under the BLS’s Standard Occupational Classification system, both Business-operations specialists (13-1000) and Project management specialists (13-1082) are subsets of the much broader “Business and Financial Operations” category (13-0000). In May 2023, that broader category was more than 10 times larger than the Project management specialists subcategory, so is likely to be much less noisy. I suspect much of the “growth” in subcategories was actually just caused by employment shifting between categories. In particular, the “Project management specialists” category was only added in 2018 and saw around ~30% “growth” according to The Economist’s infographic. But since the broader “Business and Financial Operations” category saw < 10% growth, I suspect much of the growth in Project management specialists came at the expense of other subcategories.
Similarly, Mathematical science operations (15-2000) is a subset of the much broader “Computer and Mathematical Occupations” category (15-0000). There were barely 370,000 workers in the former subcategory in 2023. The broader category had over 5 million.
3. Data does not seem reliable
It was the Economist’s claim that paralegals had seen +21% job growth over the 2022 to 2025 period that piqued my interest in the first place. As my table above shows, the the FRED data showed a -2.6% decline in paralegal jobs between 2022 and 2025.
Now, I’m not saying The Economist just made up their figures. When I first emailed them about this figure, they said they had used a 6-month moving average of monthly disaggregated household data from EPI Microdata Extracts, which might explain the difference. This microdata is not very user-friendly, and I am not a data scientist, which is why I used the FRED summaries of the annual figures instead. The Economist may well have legitimately gotten a different figure using 6-month moving averages for the microdata.
But the size of this difference should be enough to make one question the reliability of the data. If the data is noisy enough to produce a gap of almost 25 percentage points depending on whether you take a 6-month or annual average, one should hesitate before drawing any conclusions from it.
Conclusion
On 8 February, I wrote a second email to The Economist explaining my concerns (my first email just asked about their data source). To date, I haven’t received a response to my concerns.
Overall, I felt pretty disappointed. I’ve followed The Economist for over 10 years and pay to subscribe to their podcasts. I know that The Economist has a certain ideological bent (classical liberalism, pro-market), so I wasn’t surprised to see them publish a techno-optimist article arguing that worries about AI displacing jobs were overblown, and that new tasks will emerge. The future is inherently hard to predict, and reasonable people can disagree on how bad the labour disruption may get.
But fairly interpreting statistics about the past shouldn’t be that difficult, and the issues above are (imo) pretty glaring. I had always considered The Economist to be a reasonably credible source of news, with high editorial and fact-checking standards. I’m not writing them off entirely — I still think they’re better than most news outlets — but I have certainly downgraded my view of them.
If you spot any errors in the above, or if you’re willing to take a look at the microdata, please let me know!
2 thoughts on “Fact-checking an AI optimist article in The Economist”
Interesting post but there are a few issues to bear in mind:
1. You write, ” How do we know the growth in these white-collar occupations didn’t just reflect growth in the US economy more generally? How did job growth compare to previous 3-year periods?” Second point is excellent, but the first is a bit problematic. Pessimistic views of automation argue it is destroying jobs faster than the economy can create them, but if growth in white-collar occs “merely” reflects growth in the economy more generally, then the pessimistic view is, in fact, unsupported. This doesn’t rule out the possibility that The Economist is presenting an overly rosy view by suggesting above-average growth of paralegals, but if we’re in a steady-state situation in which an occupation grows at the average rate, maintaining its percentage share of the workforce, this is a serious strike against the argument that AI will lead to mass job losses and occupational extinctions.
2. More generally, I would strongly encourage you to look at changes in occupational size in terms of their percentage of the workforce, as well as absolute size. Population aging and retiring baby boom cohorts will lead to much slower labor force growth from now onwards, so it won’t be difficult to find slower growth in the absolute size of occupations that reflects slower growth in the labor force more generally. Comparing changes in absolute growth rates can be very misleading on their own, so check changes in percentage shares, as well.
3. Your section on data reliability is very interesting. The BLS runs two major data programs collecting occupational information, the household survey named the Current Population Survey, used by The Economist and the employer survey known as the Occupational Employment and Wage Survey, which may the source of the FRED data you used. The OEWS probably provides a better source of occupational data because employers are probably more accurate and effective respondents than workers (or their spouses acting as proxy respondents). However, the OEWS is a three-year rolling average so you would probably not want to use it for very short time series that includes recession years. Also, it is known that the household and employer surveys can give conflicting pictures of occupational trends, not always for known reasons.
If you’re interested in how I’ve approached this issue, see my paper, “Growth trends for selected occupations considered at risk from automation,” Monthly Labor Review, July 2022. It contains a longer time series than your post but stops earlier than the current iteration of the automation debate.
https://www.bls.gov/opub/mlr/2022/article/growth-trends-for-selected-occupations-considered-at-risk-from-automation.htm
Hi Michael – thanks very much for your detailed and thoughtful comment! On your various points:
1. Yeah, my issue was really that The Economist didn’t present any baseline at all and were too rosy. If the data showed that growth in the selected white-collar professions was less than the growth in the US economy generally, it may mildly support the pessimistic view. But The Economist article claimed in its subtitle that “Rather than wipe out office jobs, artificial intelligence will expand their scope and raise their value” (emphasis added). That is a much stronger, positive claim that goes beyond merely rebutting the pessimistic case. So even if the baseline showed that growth in the white-collar professions matched but didn’t exceed the growth in the general US economy, I still don’t think it would support that stronger claim – it would have to exceed the general growth to do so.
On the pessimistic view more generally – from what I understand, it isn’t really supported by the data yet. The main study I am aware of supporting a pessimistic view is Brynjolfsson’s 2025 “Canaries in the Coal Mine” paper, and even then the effects are pretty small and debatable. If The Economist article had just focused on the actual studies done so far and said “there isn’t much to see here yet”, I wouldn’t have objected at all. While I am mildly surprised that AI so far does appears to have very limited employment effects, I still don’t think current models have yet reached a stage where they can easily replace most white-collar workers without a significant drop in quality. I expect that to change if the AI labs ever crack the “continual learning” problem. For the record, I don’t buy the claim that “AI will take all the jobs”, but I do think if continual learning is solved it could cause enough of a disruption that it could threaten political stability as well as the government’s fiscal capacity.
2. Agree, this would be a much better way of assessing AI’s impacts on employment. Also, good point re: population aging.
3. Good to know, thanks! Yes, there does seem to be a trade-off between timeliness of data and reliability when it comes to survey data. The study by Brynjolfsson used payroll data which may be a better source – though obviously that data won’t be publicly available.
Thanks for sharing your paper – it looks like a careful and balanced piece of work. Look forward to seeing any more recent work you put out in this space 🙂